How to connect and send data points from Node-RED to StatStream ?
Summary
Introduction
In today’s fast-paced world, the Internet of Things (IoT) is revolutionizing industries, but managing the massive data generated by IoT sensors presents significant challenges. StatStream addresses these challenges by streamlining data collection, storage, analysis, and visualization.
Using Node-RED’s visual programming and MQTT’s efficient messaging protocol, StatStream creates seamless data flows, turning your IoT data into actionable insights. Let’s learn how StatStream simplifies IoT data management and helps industries thrive in the digital age.
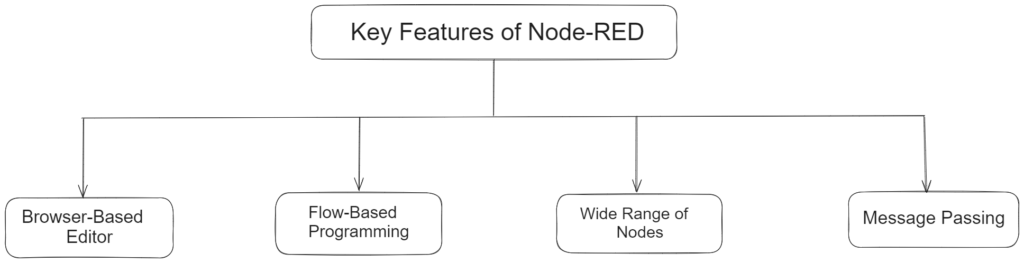
What is Node-RED?
Node-RED is a programming tool for wiring together hardware devices, APIs and online services. It provides a browser-based editor that makes it easy to wire together flows using the wide range of nodes in the palette that can be deployed to its runtime in a single-click. Node-RED is commonly installed in Raspberry pi for automating industrial processes and connecting remote customer locations, it can also be separately installed on a dedicated server to build and deploy IoT applications, by wiring together the required hardware devices.
What is MQTT?
MQTT is a standards-based messaging protocol designed for machine-to-machine communication. It is commonly used by smart sensors, wearables, and other Internet of Things (IoT) devices to transmit and receive data over networks with limited bandwidth. The simplicity and efficiency of MQTT make it ideal for IoT applications, enabling seamless data communication. MQTT facilitates messaging between devices and the cloud, as well as from the cloud back to the devices, ensuring reliable and efficient data transmission.
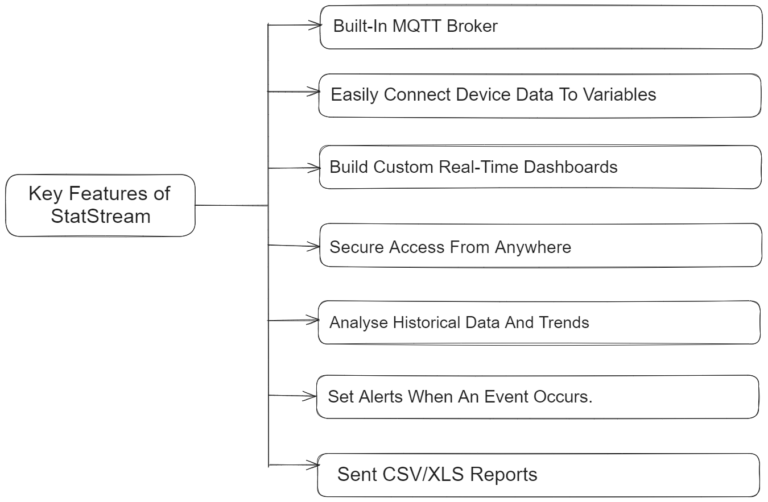
What is StatStream?
StatStream is a simple, powerful and secure cloud IoT Platform for Industries, Automation Service Providers and Energy Managers. It is an IoT system that collects and evaluates crucial data from devices, machinery, chemical processes and sensors to gain insights, enhance efficiency, monitor remote industrial processes, and generate reports.
How to send data points from Node-RED to StatStream?
To visualize the data in StatStream we can push the data points to StatStream with Node-RED. Please follow the below steps:
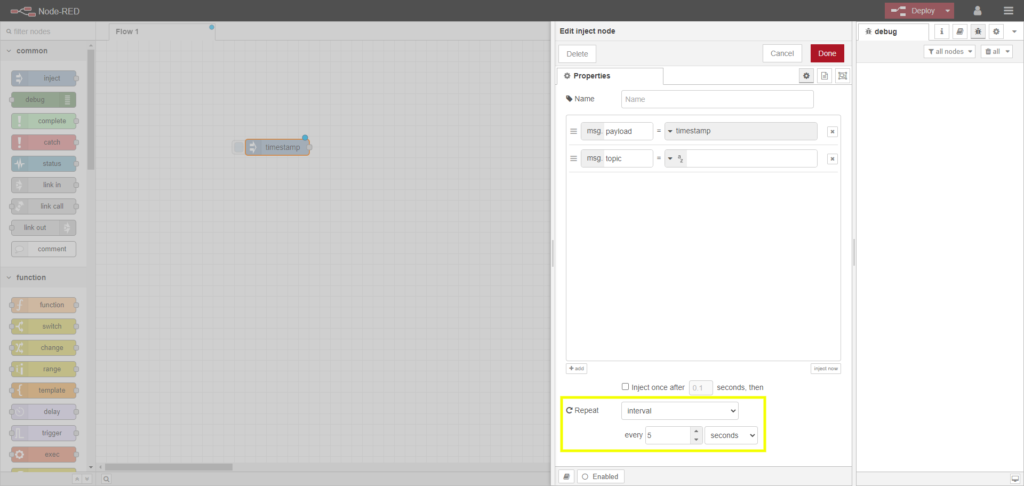
Step 1: First add an “Inject” node to send data points to StatStream every 5 seconds. The Inject node can be used to manually trigger a flow by clicking the node’s button within the editor. It can also be used to automatically trigger flows at regular intervals.
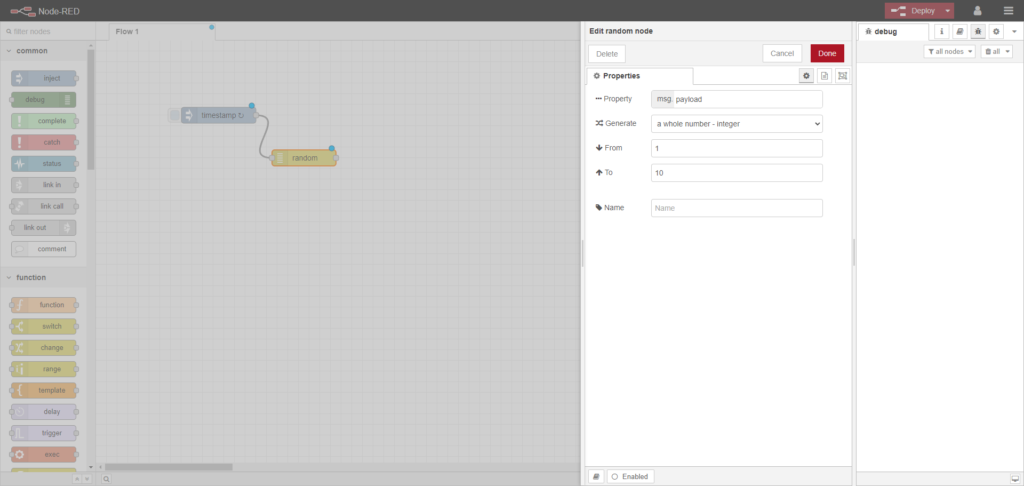
Step 2: For testing purpose , here you can add a “Random” node to your workflow to generate a randomized whole number integer between 1 to 10. A “Random” node is a Node-RED node that when triggered generates a random number between two values.
Step 3: Then add the debug node that can be used to display messages in the Debug sidebar within the editor.
Step 4: Now deploy the workflow. The sidebar provides a structured view of the messages it sends, making it easier to explore the message. Alongside each message, the debug sidebar includes information about the time the message was received.
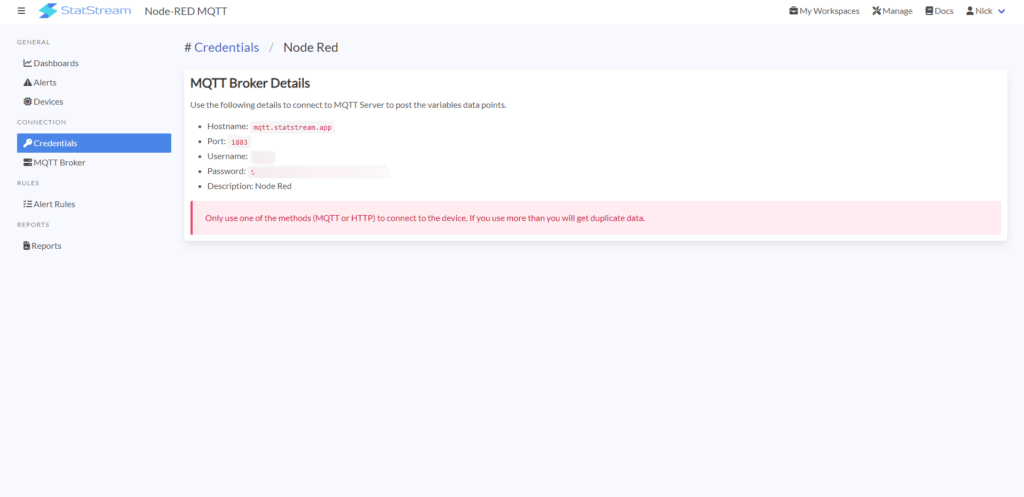
Step 5: Create a workspace on the StatStream also create a device and variable and configure your credentials and save it to use in Node-RED. To create the the workspace, device and variable in StatStream you can follow the below documentation link- StatStream Docs
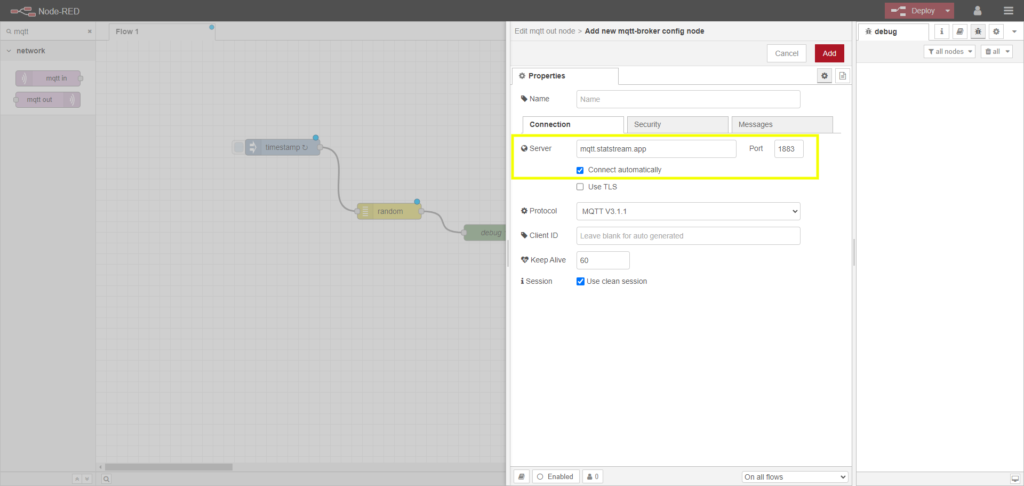
Step 6: After creating the credentials on StatStream you can add the MQTT OUT node and copy all the MQTT broker credentials one by one in the MQTT node. The MQTT OUT node connects to a MQTT broker and publishes messages on specific MQTT topic.
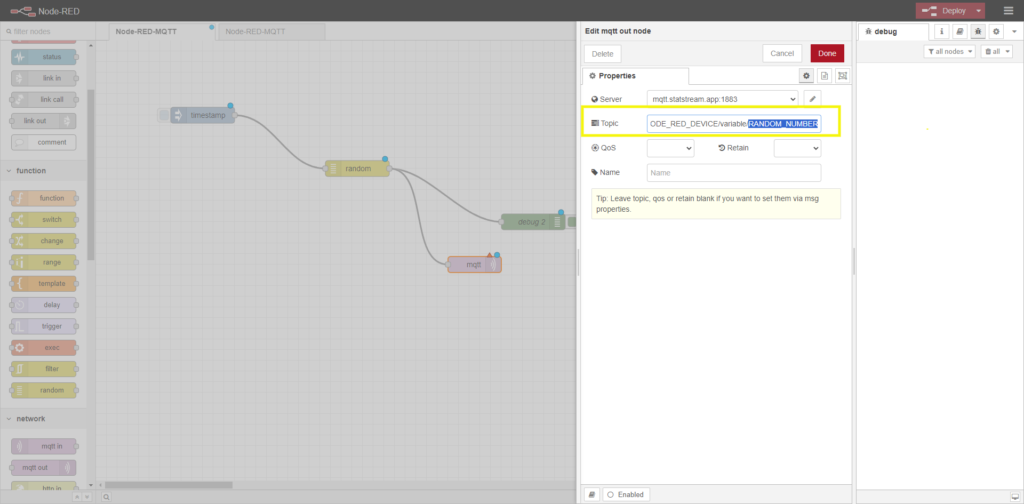
Step 7: Now you have to add the JSON Topic value and replace the placeholder with actual Variable_ID. Let’s connect the “Random” node with the MQTT out node to test the entire workflow.
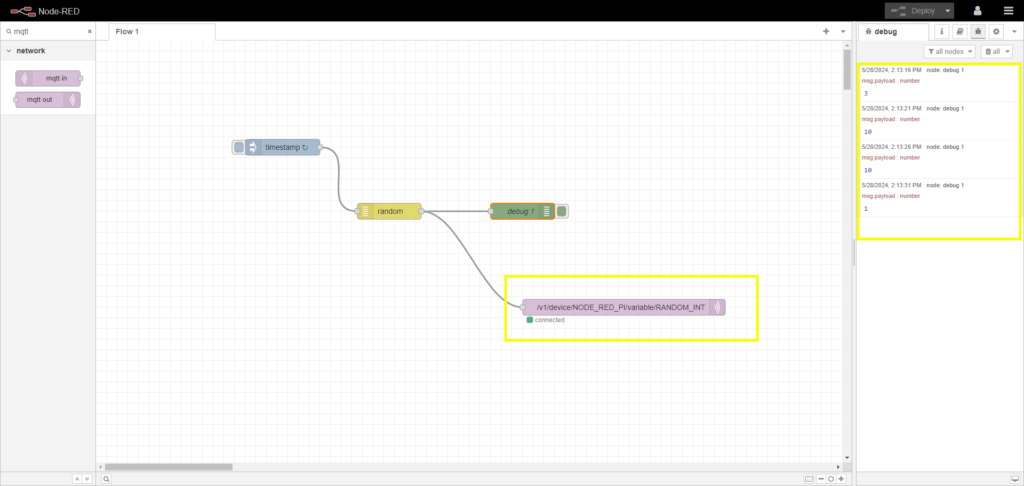
Step 8: Now you can see the workflow is deployed and also it got successfully connected with the StaStream broker that we configured.
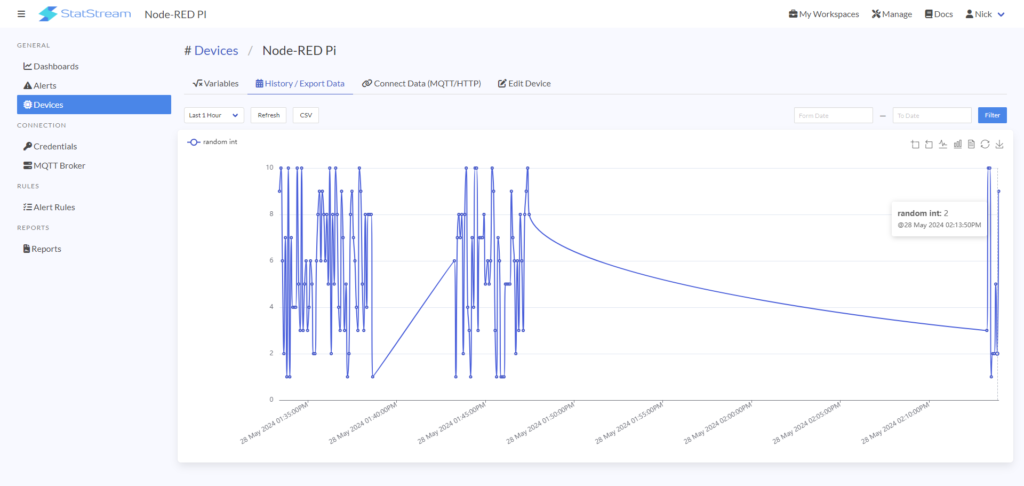
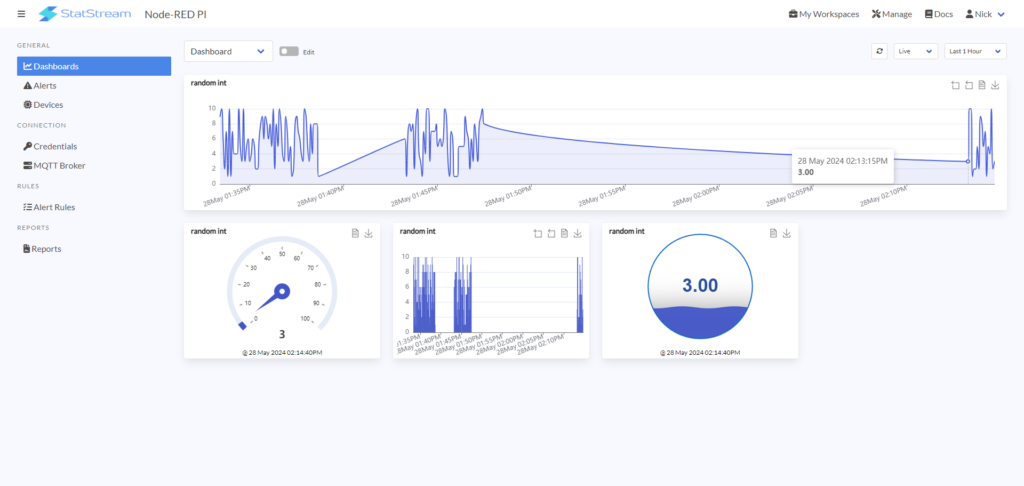
Step 9: Now you can seethe actual values being pushed to StatStream under the History tab. Also you can add multiple types of widgets in StatStream such as- line, graph, value card, gauge and liquid level while creating a dashboard in your workspace.
Summary
StatStream stands out as a comprehensive solution for managing the complexities of IoT data. By harnessing the power of Node-RED’s visual programming and MQTT’s efficient messaging protocol, StatStream simplifies the process of gathering, storing, analyzing, and visualizing data generated by IoT devices. Through its capabilities, StatStream enables industries to transform raw IoT data into actionable insights, optimizing efficiency and offering the foundation for informed decision-making in the digital age.
Ultimately, by leveraging the features and capabilities outlined, StatStream proves to be a valuable asset for businesses seeking to navigate the challenges of IoT data management and thrive in the digital landscape.